


Overview
1109 articles were yielded. (Fig. 1) After the removal of duplication (n = 507), 602 articles were screened for titles and abstracts. Of these, 46 articles proceeded to full-text screening. Ultimately, 12 articles met the inclusion criteria and were included in the study [18,19,20,21,22,23,24,25,26,27,28,29].

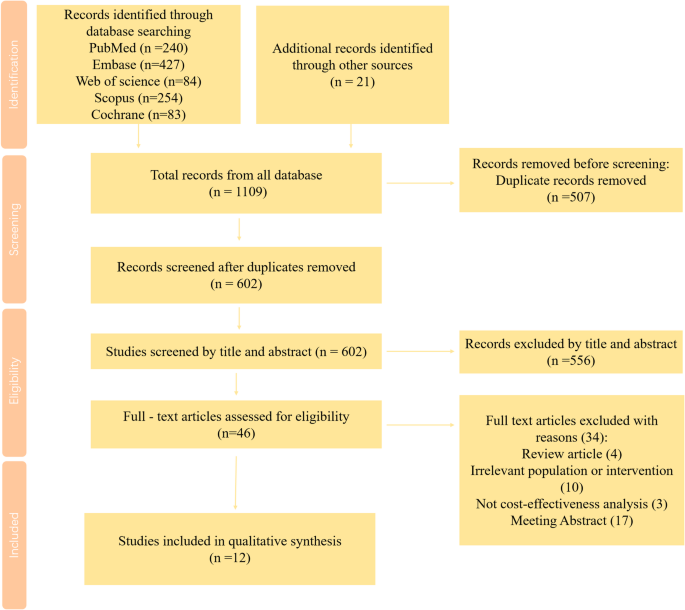
PRISMA flow chart for study selection
Quality evaluation
The results of the quality evaluation of the selected articles were summarized in Table 1; Fig. 2. None of the studies met all of the quality criteria outlined. The number of studies that scored “completely satisfied” on the CHEERS checklist ranged from 21 to 23 out of a total of 28 criteria. None of the 12 studies addressed the following 4 criteria: (4) health economic analysis plan, (19) characterizing distributional effect, (21) approach to engagement with patients and others affected by the study, and (25) effect of engagement with patients and others affected by the study. Additionally, all 12 studies scored above 0.75.

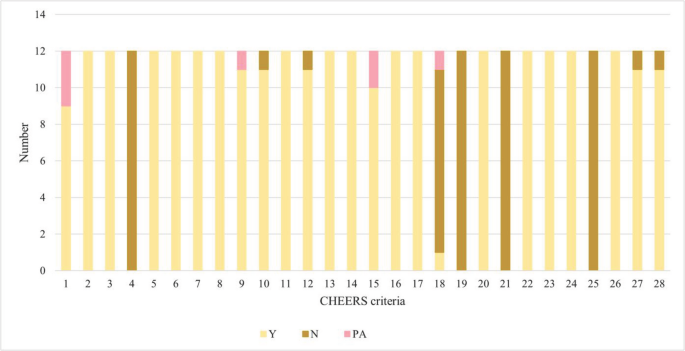
Quality assessment results of the included studies
Study characteristics
The general characteristics of the selected studies are summarized in Table 2. 3 studies were conducted in China [19, 27, 29], 3 in the US [18, 21], 2 in the UK [22, 28], and 2 in Spain [23, 25]. Additionally, 1 study was carried out in Colombia, Iran, and the Netherlands [20, 24, 26]. The majority of the studies were conducted from the healthcare system’s perspective (n = 10) [19, 21,22,23,24,25,26,27,28,29]. Of the remaining studies, one was analyzed from the payer’s perspective [18], and another from the societal perspective [20].
All the studies reported the time horizon. Most studies used a long-term time horizon, which included a lifetime time horizon, 40-year horizon, or 50-year horizon (n = 10) [18,19,20,21,22,23, 25, 27,28,29]. In contrast, two studies conducted short-term time horizons of 5 years or 10 years [24, 26].
Out of the 12 included studies, 3 used the IQVIA CORE Diabetes Model (version 9.0) [20, 22, 23]. Three studies applied the UKPDS OM2 [19, 21, 29], while one study adopted a state-transition model based on the UKPDS OM1 equations [18]. Additionally, two studies utilized a 5-state Markov model structure [24, 26]. The remaining studies were conducted using the Cardiff Diabetes Model [25], the CHIME simulation model [27], and the IMS CORE Diabetes Model [28].
Regarding the comparisons made in these studies, 2 focused on different GLP-1RA (liraglutide vs. dulaglutide and liraglutide vs. oral semaglutide) [18, 19]. Four studies compared liraglutide vs. oral semaglutide [20,21,22,23], while six studies compared liraglutide vs. dulaglutide [24,25,26,27,28,29].
Primary outcomes
Liraglutide vs. oral semaglutide
Six studies estimated the economic evaluation of liraglutide versus oral semaglutide for T2D, and the results were consistent across all studies [18,19,20,21,22,23]. All the studies indicated that oral semaglutide was cost-effective compared to liraglutide (Table 3).
Four out of the six studies showed that oral semaglutide was not only less costly but also more effective. Oral semaglutide was considered a cost-saving and dominant treatment for T2D patients in the US [18], the Netherlands [20], Spain [22], and the UK [23]. The incremental QALY gained ranged between 0.009 and 0.09, and the cost savings varied from $1642.38 to $6074.74 [18, 20, 22, 23]. In another study in the US, oral semaglutide was also found to be cost-effective compared to liraglutide, with an ICER of $44836.55 per QALY [21]. Although the ICER and total costs differed between the two studies from the perspective of payers and healthcare systems in the US, oral semaglutide was consistently deemed cost-effective compared to liraglutide [18, 21]. In a study conducted in China, oral semaglutide was determined to be cost-effective by gaining an additional 0.03 QALYs and 0.02 LYGs at an increased cost of $742.87, resulting in an ICER of $33041.06 per QALY with the WTP of $36528.3 per QALY [19]. (Figures 3 and 4)

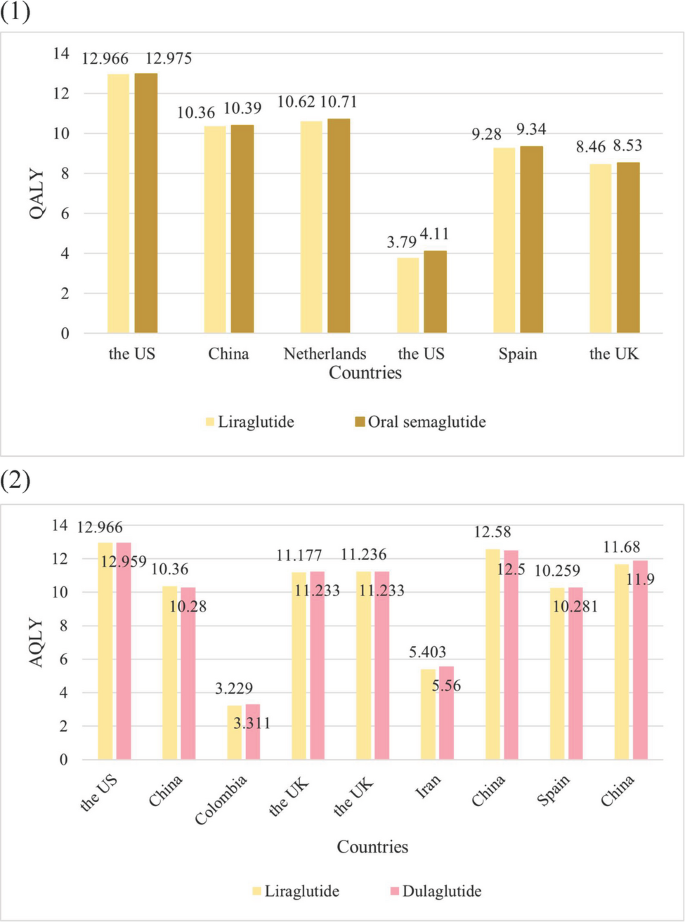
QALY of Liraglutide vs. Dulaglutide or Oral Semaglutide. (1) Liraglutide vs. Oral Semaglutide (2) Liraglutide vs. Dulaglutide

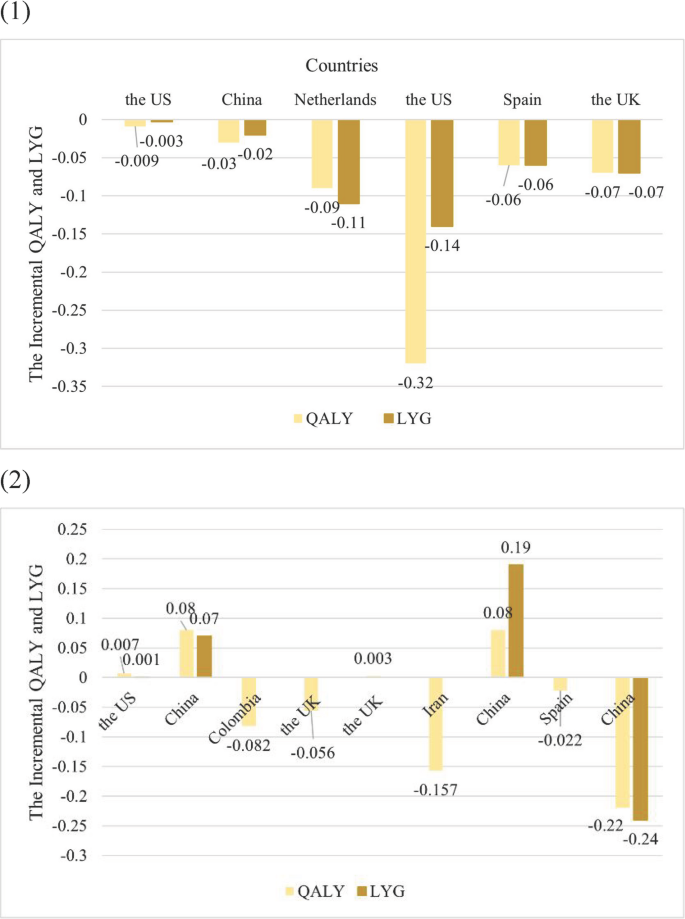
Incremental QALY and LYG of liraglutide vs. dulaglutide or oral semaglutide. (1) Liraglutide vs. oral semaglutide (2) Liraglutide vs. dulaglutide
Liraglutide vs. dulaglutide
Studies compared the economic evaluations of liraglutide vs. dulaglutide for T2D. (Table 3)
Dulaglutide was shown to be dominant versus liraglutide in Colombia, Iran, and Spain by gaining 0.082, 0.157, and 0.022 additional QALYs while saving $2579.94, $1084.37, and $1926.58, respectively [24, 26, 28]. In the three studies conducted in China, dulaglutide demonstrated cost-effectiveness versus liraglutide, with varying ICERs [19, 27, 29]. In both Feng et al.’s and Yuan et al.’s studies, liraglutide was found to be more expensive and more effective than dulaglutide, with total costs of $29480.23 for liraglutide versus $26516.60 for dulaglutide, and $47,026 compared to $42,763. The QALYs were 10.36 for liraglutide versus 10.28 for dulaglutide, and 12.58 versus 12.50, respectively. The ICER was $37045.38 per QALY and $53287.5 per QALY, both exceeding the WTP of $36528.3 per QALY and $12,728 per QALY, respectively [19, 27]. Another study in China by Xie et al. indicated that dulaglutide was more expensive and more effective compared to liraglutide, yielding an ICER of $15419.01 per QALY under the WTP of $38,223 per QALY [29]. Due to the ICER of $599852.16 per QALY and the WTP of $169906.87 per QALY, liraglutide was not cost-effective compared to dulaglutide under the US payer perspective [18]. In the study by Chuang L.H. et al., neither the 1.2 mg nor the 1.8 mg daily doses of liraglutide were found to be cost-effective compared to dulaglutide from the UK healthcare system perspective [25]. With an incremental QALYs of 0.056 and incremental cost of $132.51, dulaglutide was cost-effective compared to the 1.2 mg daily dose of liraglutide, resulting in the ICER of $2366.30 per QALY [25]. While the 1.6 mg daily dose of liraglutide is more effective and more expensive than dulaglutide, it was not cost-effective due to the high ICER of $122872.18 per QALY [25]. (Figures 3 and 4).
Sensitivity analysis
In 11 out of the 12 articles, sensitivity analysis was conducted, which includes scenario analyses, one-way sensitivity analysis (OWSA), and probabilistic sensitivity analysis (PSA). The findings showed that the results are generally robust, indicating that liraglutide was not cost-effective compared to oral semaglutide or dulaglutide. (Table 4)
Liraglutide vs. oral semaglutide
The OWSA indicated that the price of oral semaglutide, BMI treatment effects maintained for patients’ lifetimes, the discount rate, and treatment switching at 7.0% HbA1c had the most significant influence on the results [18, 22, 23]. The results of PSA demonstrated that the probability of liraglutide achieving cost-effectiveness ranged from only 0.0–31.7% [20,21,22,23]. Most scenario analysis results did not change the baseline results. In the study by Feng et al. in China, for shorter time horizons (10 years), liraglutide may be more cost-effective than oral semaglutide [19].
Liraglutide vs. dulaglutide
The OWSA indicated that the price of dulaglutide and liraglutide, the HbA1c reduction of liraglutide, the utility resulting from less injection frequency of dulaglutide, the time horizon, and the discount rate are the most sensitive variables [26, 28, 29]. The results of PSA showed that the likelihood of liraglutide achieving cost-effectiveness ranged from only 0.0–2% [26, 28, 29]. The outcomes of scenario analysis were consistent with the base-case results.
Subgroup analysis
The subgroup analysis by Malkin S J P et al. comparing liraglutide and oral semaglutide in patients with at least 30 kg/m2 at baseline confirmed that oral semaglutide is dominant. (Table 5)
link